

All week the market had crawled up no matter what news came out about the economy or virus. We all have first and second hand experience about what damage is being caused along with the ripple effects that are waiting in the wings.
I, personally, keep thinking of the chain of economic events that I personally will have negative effects on such as:
- I didn’t rent that RV to go to that festival
- Didn’t buy the festival tickets nor all the vendors who I would support by being there
- Didn’t get the hotel rooms for the business trips I had planned
- My social activity costs are less because, well, I haven’t been out and about to see friends
And then I think about how many people down the line that affects. Think about the people who own RV’s who were counting on several thousand dollars of income from that this summer. Then think about the mechanic who would be fixing that RV, changing it’s oil, or replacing its tires that will no longer happen because the RV isn’t getting used.
There are so many downline effects that have basically put a giant void into people’s year. Despite that, the market is in lockstep on its way up and countless stocks are popping on earnings reports. Most companies are leaving out future guidance, which is reasonable, but then they are exploding on earnings. Perhaps this is because they have gotten loans that don’t have to be touched for a year and then after that are cheap for the next 4 years. Not to mention how much money the Fed is putting into the economy as a whole via asset purchases.
Check out this chart to see how the market’s up move has corresponded with the increase of the Fed’s balance sheet. Pretty clear to see what’s happening isn’t it? Also keep in mind that we were never able to reduce the Fed’s balance sheet from 2008 and so we are still carrying that debt 12 years later into this new crisis.
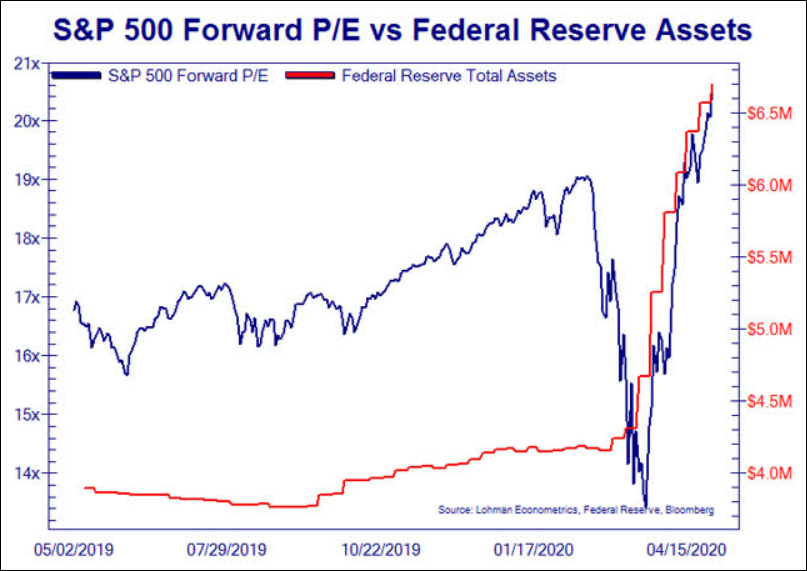
Logic would seem to indicate that the Fed can’t stave off the damage of a frozen economy indefinitely, but it is sure doing a great job right now. We need to be both aware of the influence and extremely careful about the reality of the situation. I tend to be very reliant on stock charts to tell me the real story of what is going on since that is where it will be most visibly seen. But with the manipulation of Godzilla sized liquidity, some technical metrics are getting thrown out of whack.
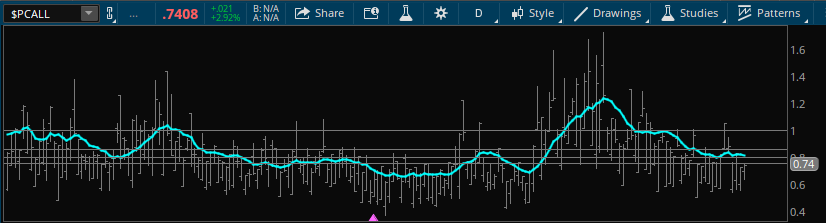
Take the Put/Call ratio for example; It is now at levels that indicate there are very few buyers left to support the market and the balance needs to shift, but price hasn’t reacted yet. We have also seen in the recent past that a low ratio can persist for quite some time, but when it finally changes, it can have an outsized effect on the market. Basically, keep things going as long as possible, but when it finally stops, expect it to break sharply. Maybe this is also part of computers trading so much too.
The market has so far hit all of my upper targets and looks like it wants to keep going. The next area of potential resistance I see is about SPY $300 due to all the significant moving averages at that level. Only time will tell if it will be the final target, or if the Fed’s printer is more like the little engine that could.
