

Hey Market Pilots,
There are common patterns in the market which we need to know about in order to make proper decisions and money. This week, I saw a particular type of bottoming pattern form on a few names and the market itself.
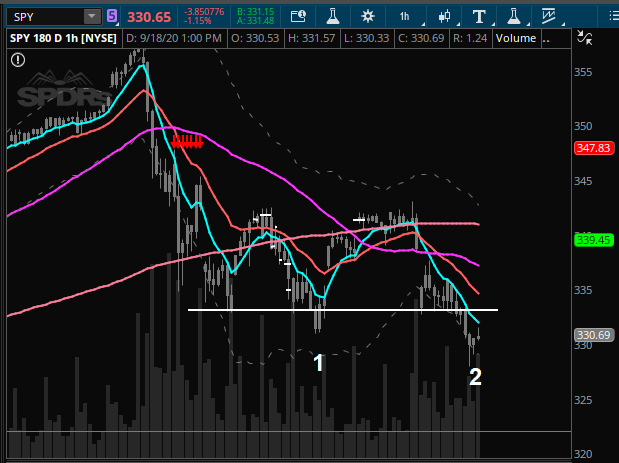
I’m very familiar with a double bottom pattern and how it advertises that price doesn’t want to go lower. But what about when a double bottom does break lower? Oftentimes that is a perfect short entry, but other times that is the exact washout move that is needed in order to finally get price moving the other direction. I refer to this as the undercut and it looks like we just got that with the SPY Friday.
Let me show you a few examples in other names so you can better see it when I show you the SPY. Here in WING, you can see that there was a double bottom forming, then suddenly price dropped out from that level. But that wasn’t the start of a new downtrend. In fact, it quickly got bought up and made some new highs. From this point forward, if the price action doesn’t go lower, then the move is to the upside and we should see nice movement in that direction.

Next is SPOT and you can see the same double bottom, with a sudden drop lower. That drop got bought up and is now holding steady as it builds support. I would be looking for price to start moving up from here and turn the MA from resistance into support.

Now with SPY, you can see this kind of action is happening for the second time. The first time worked also, drop below the double bottom area then get bought up. Turns out it needed to do it again, but this time if it works, I figure it will be the real deal and SPY should start climbing upward in earnest.
Over and Out,
Your Profit Pilot.
