

Hey Market Pilots,
The market has been on a tear since the Covid-19 low back around mid-March of last year, but there have been some levels where the market has become volatile and run into resistance. Many of those areas coincide with Fibonacci (Fib) levels, which I think is fascinating. I always wonder if Fibonacci points have become a self-fulfilling prophecy much in the way that the adage of “sell in May and go away” has become its own self-fulfilling prophecy.
As far as average true range (ATR) levels go, Fibonacci points make a little bit more sense to me because computer algorithms use them to understand when prices have gone too far in either direction. I use these quite often in my trading to help give me an outer range to be aware of and to know when a move is likely to run out of energy or possibly reverse.
When you combine these two types of trading parameters, it’s amazing to see when they line up. It’s even more impressive when they line up on the higher time frames, as those time frames have more power and mean more to the market.
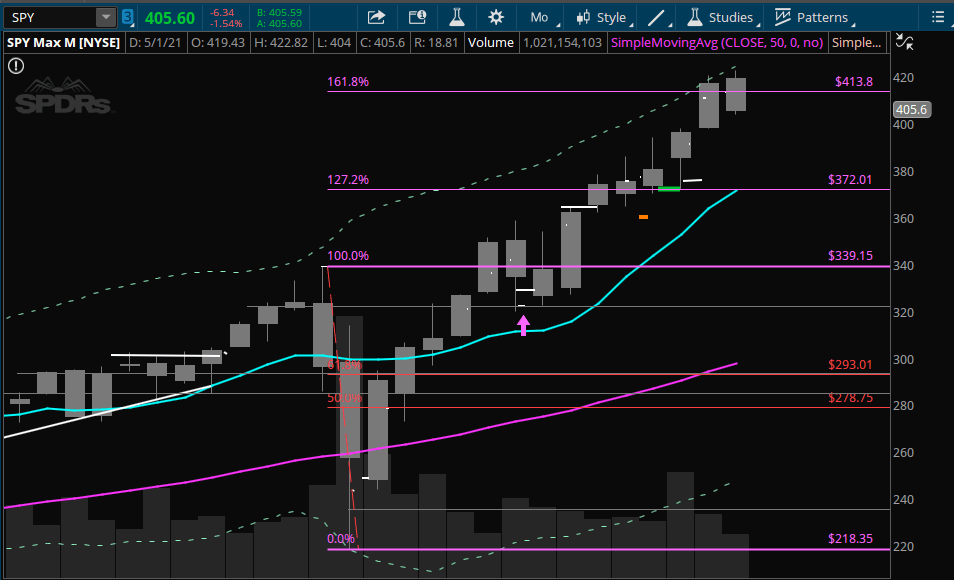
Pictured below is the S&P 500 (SPY) monthly. You can see the first level of congestion was at the 100% retracement. This makes sense on its own, because people are trying to decide if price can really get past the previous all-time high. The next area of consolidation we can see was at the 127.2% Fib, where price flagged sideways for a while and then managed to move higher. Perhaps this was possible because price was not hitting the outer limits of the ATR levels.
So that brings us to where the market is currently ー at the 161.8% Fib and at the monthly third ATR. This Fib is typically the final extension that traders watch for a price target before a significant pullback occurs. And the third ATR is what I typically use as a strong indication that price is getting too far from support.
Now we factor in the weekly chart (pictured below) and we can see that the market jumped straight up to the 161.8% Fib and to the weekly third ATR. Almost like it was a magnet ー or a prophecy that needed to be fulfilled…

I also find it fascinating that these outer ranges were met right as the timing of “sell in May and go away” came upon us. Now that we are headed for summer break where people are starting to travel and spend time with their family and kids are out of school, the market is probably going to continue to be choppy for several months. Not to mention that since the market has hit these outer boundaries, it would be healthy for prices to cycle back down in order to provide room for when stocks are seasonally strong in the fall months.
Take it easy out there ー the markets are difficult and the long side is decaying.
Your Profit Pilot, TG.
